
This is a fairly brief look at the software i’ve written for this project, the firmware and the script to process the collected data.
Firmware
Overview
I have been writing firmware for embedded systems for many years, writing code for a home project like this one is different from writing production ready software professionally. The code is not production ready, it’s really only the minimal amount of code required to exercise the hardware and to get some basic logging working. If I were to make this production ready I would do at least the following:
- Check and handle all possible errors.
- Maybe add a facility to log errors.
- Have a timeout in all loops (remove the possibility of infinite loops).
- Enable the watchdog.
- Extend some of the drivers to make them more configurable.
- Reduce the code size massively by conditionally compiling the test code or moving it into another object.
- Add a self test on startup.
- Add a production mode to test the hardware.
Availability
All of the code and kicad design files are available on github under the MIT license.
Not using external libraries
This code doesn’t use any libraries for a couple of reasons, I don’t often get the chance to write every bit of code for a system so it’s quite nice to when doing home projects. This code doesn’t take much space as everything is specialised to this specific task, this is harder to achieve when using libraries.
Current capabilities
The initial intention when writing this code was to have a logger I could leave in the car to log data, just press a couple of buttons to start/stop logging and then get the data off. The current state of the code is more useful for debugging and prototyping, but isn’t a finished product. When the device boots it goes straight into a menu system and everything is driven from there, you have to have a PC plugged in over serial to get it do anything, this could easily be changed in the future.
Architecture
The architecture of the firmware is very simple, I find the simpler things are the easier they are to debug and maintain. The most complex area of this code is the logger file system, this was the hardest part to keep simple.
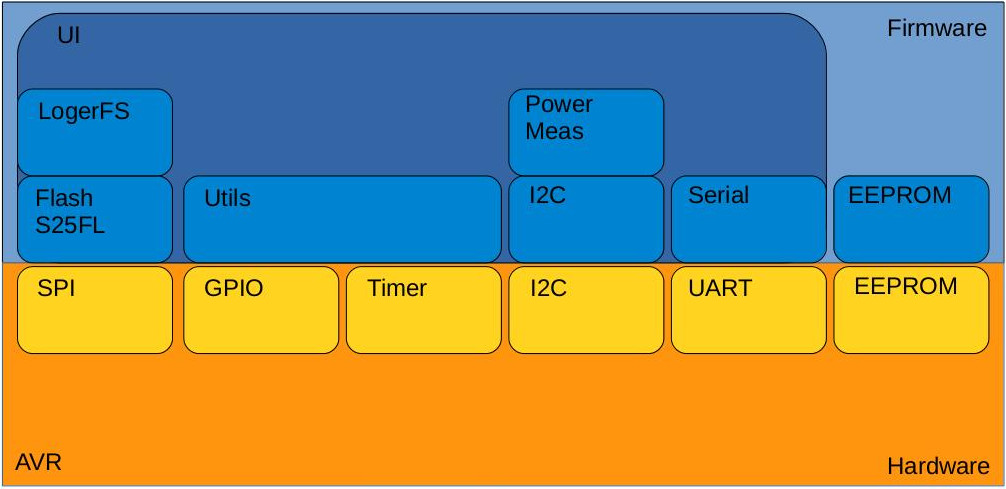
The diagram below shows how the components of the system interact, the parts in yellow are on the hardware side (in the AVR chip where the code is running) and the blue parts are the firmware. I hope the diagram is self explanatory.
Menu system
The menu system is driven by a set of tables that are linked in a tree hierarchy. The tables specify a key to press to select and entry, a description of the entry, an optional handler for that entry and a link to the next table. There is a simple loop to process key input and drive the movement between the tables.
Drivers
Power measurement chip (INA226)
The driver for this chip is in pwr_meas.c and it uses the I2C layer to communicate with the chip. At the moment the configuration for this chip is hard coded in power_meas_configure(), but this could easily be extended to be configurable via an API. Reading and writing of the INA226 registers has been abstracted internally to this module. Only a few API calls have been exposed from this module, mainly to read voltages in a raw format or a scaled format.
Logging
Currently the INA226 has been configured to free run, it averages 1024 samples taken at intervals of 1.1mS, this means a new sample is available from the chip every 1.1264 seconds. When in logging mode, triggered by entering the correct state in the UI module a new sample is taken every time g_seconds_count is updated. The ISR for the timer based off the 32.768KHz crystal increments g_seconds_count. With this setup, sometimes the same sample will be gathered twice, but that is good enough to satisfy the requirements of this project. When the samples are taken by the UI module, they are then written to the file system. These samples could be compared against a threshold value, previously set in the menu, to trigger an event (light the trigger LED), but this hasn’t been implement at this time.
Flash file system
The SPI flash i’m using has 64KB blocks (sector) and 256B pages, with flash you can write pages once the block that contains the page has been erased. In the code the terms “sector” and “block” are used interchangeably. Every sector has a header that contains the logging session being recorded and the sequence number, this can cause a bit of fragmentation as it is possible only one page is used in a sector when the logging session is finished and when the next one is started it has to go into the next block. Searching for sessions is quite fast as you only have to inspect the start of each sector.
The general approach to the file system is to spread the wear (this chip should be good for 100,000 erase/write cycles) across the entire flash. This is achieved by scanning for the first empty sector when starting a new session, when the flash is full the oldest page from the oldest session is found. Pages are written sequentially. An entire page buffer is held in processor memory to hold log entries before committing them to flash, when the user requests for the logging session to be completed this page buffer is written to flash even when not full, if a power failure occurred before finishing the session the data would be lost. Each entry has a simple checksum, one day this could be used for detecting when blocks go bad, but I have no need for this feature at the moment.
Building and programming
For this project the make file handles many things:
- Builds the code.
- Programs the device code and fuse space using a AVR-ISP-MK2.
- Create a version string to embed into the image.
- Prints the size of different sections of the image.
- Read the eeprom (in the AVR).
- Searches for all of the TODO’s in the code.
- Cleans up all of the build products.
The location of the compiler and the programming tool will probably vary for others using this make file, but i’ve kept it very simple so should be simple enough for anyone to change it for their needs.
PC sofware
Currently the PC software consists of one python script graph_entry_log.py all it does is parse the log file (printed from the menu system on the device) and puts the data into a set of graphs. It converts the raw data from the INA226 (stored in flash) into real values. I find pyplot to be a great way to graph data from a script, once the data has been loaded into the program it’s easy to interact with the graph (pan + zoom + hover) to analyse the data. The raw data contains the “bus voltage” which is the voltage powering the device you are measuring and the shunt voltage which is the voltage across the shunt resistor. To convert these two voltages to something meaningful the resistance of the shunt has to be know, from this it is easy to calculate the current used and then the power used for any given measurement point.